When you start learning technical analysis, candlestick patterns are often the first thing you come across.
These tiny shapes on the chart tell big stories about buyer–seller psychology, market reversals, and trend strength.
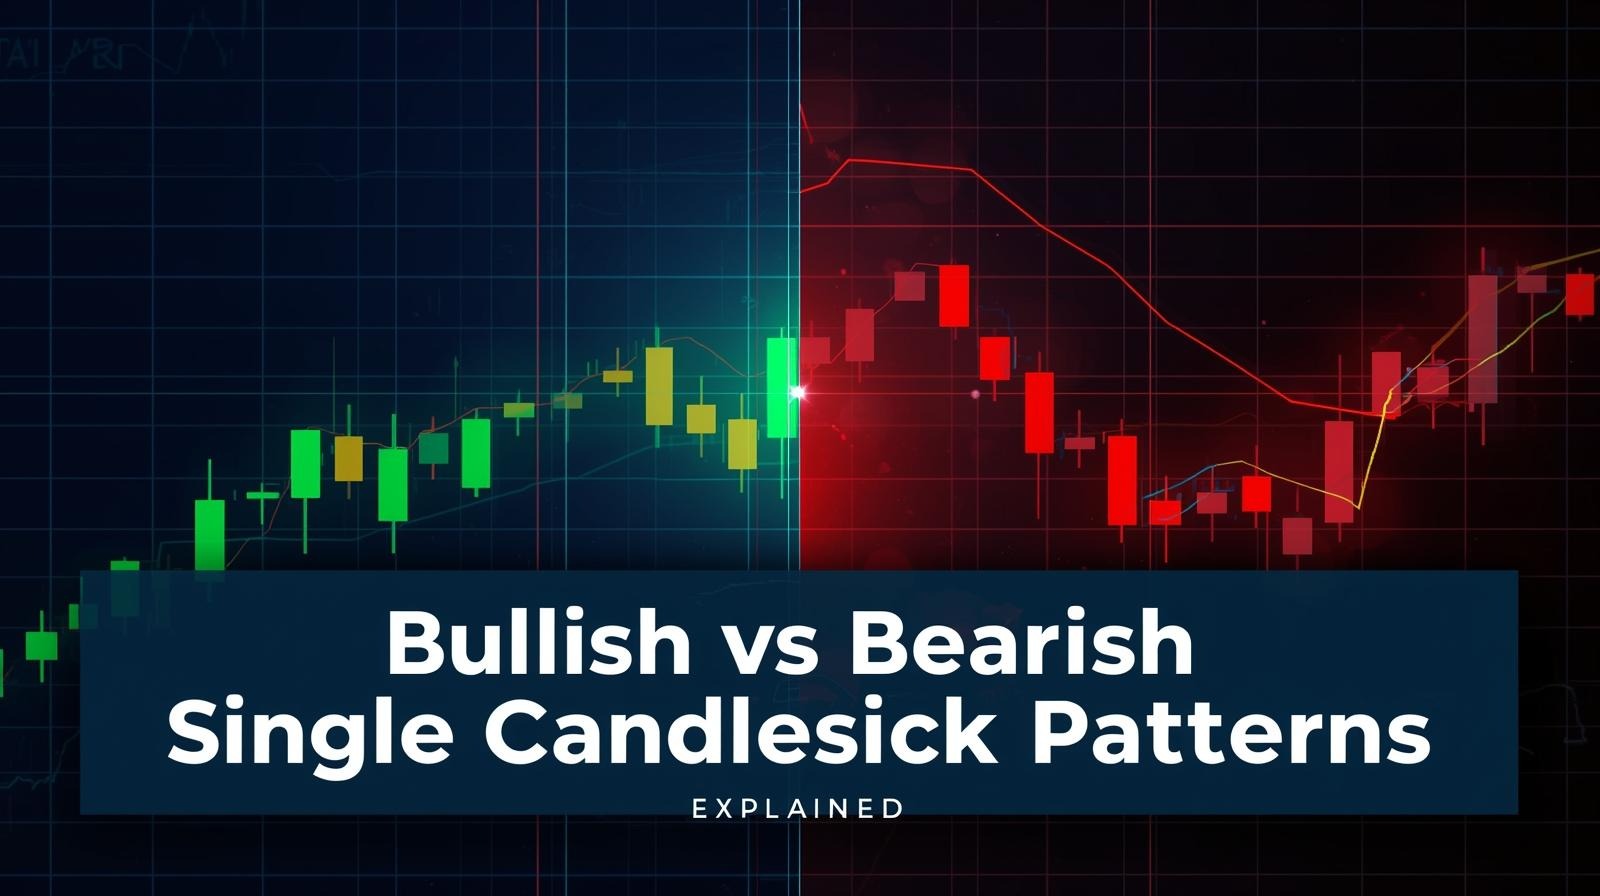
In this blog, we’ll compare the most popular bullish and bearish single candlestick patterns — side by side — so you’ll never get confused between a Hammer and a Hanging Man again!
🔹 1. Hammer vs Hanging Man Both the Hammer and Hanging Man look almost identical — but what makes the difference is where they appear on the chart.
🟢 Hammer (Bullish Reversal)
- Appears after a downtrend.
- Has a small body at the top and a long lower shadow (at least twice the body).
- Shows that buyers are coming back after sellers pushed the price down.
- When followed by a bullish candle, it confirms a reversal to the upside.
🔴 Hanging Man (Bearish Reversal)
- Appears after an uptrend.
- Looks exactly like a hammer but forms at the top of a rally.
- Indicates that sellers are starting to enter the market.
- Confirmation from a red candle the next day gives a sell signal.
🧠 Key Difference: Shape is same — trend context changes the meaning.
Hammer = Bottom reversal | Hanging Man = Top reversal.
🔹 2. Inverted Hammer vs Shooting Star These two candles have long upper wicks and small bodies, again differing by location.
🟢 Inverted Hammer (Bullish Reversal)
- Appears after a fall.
- Shows rejection at higher levels — buyers tried to lift prices, sellers resisted, but failed to close lower.
- Suggests buying pressure might rise soon.
- Confirmed when next candle closes above its high.
🔴 Shooting Star (Bearish Reversal) - Appears after a rise.
- Indicates that buyers pushed prices higher but sellers took control and forced a close near the open.
- Signals weakness and potential reversal.
🧠 Key Difference: Both look like a star with a long upper tail. - Inverted Hammer = forms at bottom, signals buying pressure.
- Shooting Star = forms at top, signals selling pressure.
🔹 3. White Marubozu vs Black Marubozu The word Marubozu means “strong” in Japanese — these candles have no shadows, only a long body.
🟢 White Marubozu (Bullish)
- Long white/green body with no wicks.
- Buyers control the entire session — price opens low and closes at day’s high.
- Strong sign of bullish momentum and trend continuation.
🔴 Black Marubozu (Bearish) - Long black/red body with no shadows.
- Sellers dominate from start to end.
- Indicates extreme bearishness and trend continuation or reversal from top.
🧠 Key Difference: - White Marubozu = Buyers in full control.
- Black Marubozu = Sellers in full control.
Both show strong conviction — no confusion or indecision.
🔹 4. Bullish Spinning Top vs Bearish Spinning Top A Spinning Top shows indecision — buyers and sellers are fighting, but neither wins.
🟢 Bullish Spinning Top
- Small body, long shadows both sides.
- Appears after a downtrend, indicating pause or potential reversal.
- If next candle is bullish, it confirms the up move.
🔴 Bearish Spinning Top - Same shape but closes slightly lower.
- Appears after an uptrend, hinting that momentum is weakening.
- Confirmation with a red candle means sellers may take control.
🧠 Key Difference: Both are neutral patterns. The color of the body and trend context tell you whether it’s leaning bullish or bearish.
🔹 5. Dragonfly Doji vs Gravestone Doji Doji candles are known for their open and close being almost the same, showing hesitation in the market.
🟢 Dragonfly Doji (Bullish)
- Looks like a “T”.
- Long lower shadow, no upper shadow.
- Appears after a downtrend — buyers push the price back up after heavy selling.
- Signals that downtrend may end soon.
🔴 Gravestone Doji (Bearish) - Looks like an inverted “T”.
- Long upper shadow, no lower shadow.
- Appears after an uptrend — sellers reject higher prices.
- Indicates possible trend reversal downward.
🧠 Key Difference: Both are Doji (open ≈ close), but - Dragonfly Doji = buyers defend the bottom, bullish sign.
- Gravestone Doji = sellers reject the top, bearish sign.
📊 Quick Comparison Table | Bullish Pattern | Bearish Counterpart | Type | Market Message |
|---|
| Hammer | Hanging Man | Reversal | Same shape, different trend |
| Inverted Hammer | Shooting Star | Reversal | Rejection at highs |
| White Marubozu | Black Marubozu | Continuation | Strong buying vs selling |
| Bullish Spinning Top | Bearish Spinning Top | Indecision | Battle between bulls & bears |
| Dragonfly Doji | Gravestone Doji | Reversal | “T” vs inverted “T” |
🧭 Key Takeaways - The same shape can mean opposite things, depending on where it appears in the trend.
- Always wait for confirmation candles before entering trades.
- Combine candlestick analysis with volume, support–resistance, or moving averages for higher accuracy.
- These single candles work best when used as entry confirmation tools, not standalone signals.
💡 Conclusion : Understanding the difference between bullish and bearish single candlestick patterns helps you read charts like a professional trader.
A single candle can reveal the battle between buyers and sellers and hint at who’s gaining control next. So next time you spot a Hammer, Doji, or Marubozu, don’t just look at its shape — look at its position in the trend.


 Launch your Graphy